Renewable energy is the future, but at present no one is tracking just who’s got solar panels on their roof, in their back yard, or a shared neighborhood installation. Fortunately, solar panels generally work best when exposed to the light. That makes them easy to spot, and count, from orbit — which is just what the DeepSolar project is doing.
There are a number of initiatives for collecting this information — some regulated, some voluntary, some automated. But none of them is comprehensive enough or accurate enough to base policy or business decisions on at a national or state level.
Stanford engineers (mechanical and civil, respectively) Arun Majumdar and Ram Rajagopal decided to remedy this with what seems like, in retrospect, rather an obvious solution.
Machine learning systems are great at looking at images and finding objects they’ve been “trained” to recognize, whether it’s cats, faces, or cars… so why not solar panels?
Their team, including grad students Jiafan Yu and Zhecheng Wang, put together an image recognition machine learning agent trained on hundreds of thousands of satellite images. The model learns both to identify the presence of solar panels in an image, and to find the shape and area of those panels.
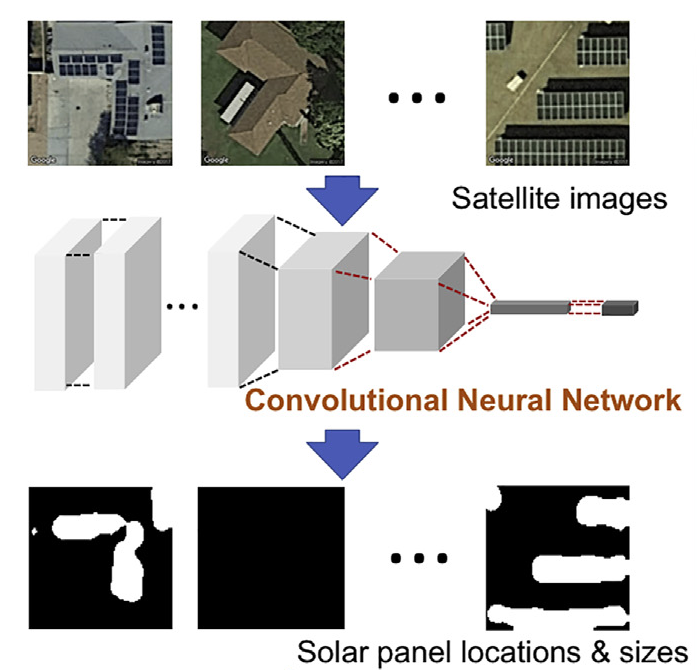
Having evaluated the model on nearly a hundred thousand other randomly sampled satellite images of the U.S., they found they achieved an accuracy of about 90 percent (slightly more or less depending on how it’s measured), which is well ahead of other models, and it estimated cell size with only about a 3 percent error. (Its main weakness is very small installations, Rajagopal told me, but this is partially due to the limits of the imagery.)
The team then put the model to work chewing through over a billion image tiles covering as much of the lower 48 states as they could find suitable imagery for. That excludes quite a bit of area, but consider that much of that is, for example, mountains. Not a lot of solar installations there, and few people are trying to put up cells in national parks.
All in all it’s about 6 percent of the actual country — but Rajagopal pointed out that urban areas comprise only about 3.5 percent, so this covers all of them and more. He estimated that perhaps perhaps 5 percent of installations are in the areas the system has yet to process (but is working on).
Scanning took a whole month, but at the end the model had found 1.47 million individual solar installations (which could be a few panels on a roof or a whole solar farm). That’s many more than have been counted by other efforts, and the most successful of those didn’t come with the exact location, as DeepSolar’s data does.
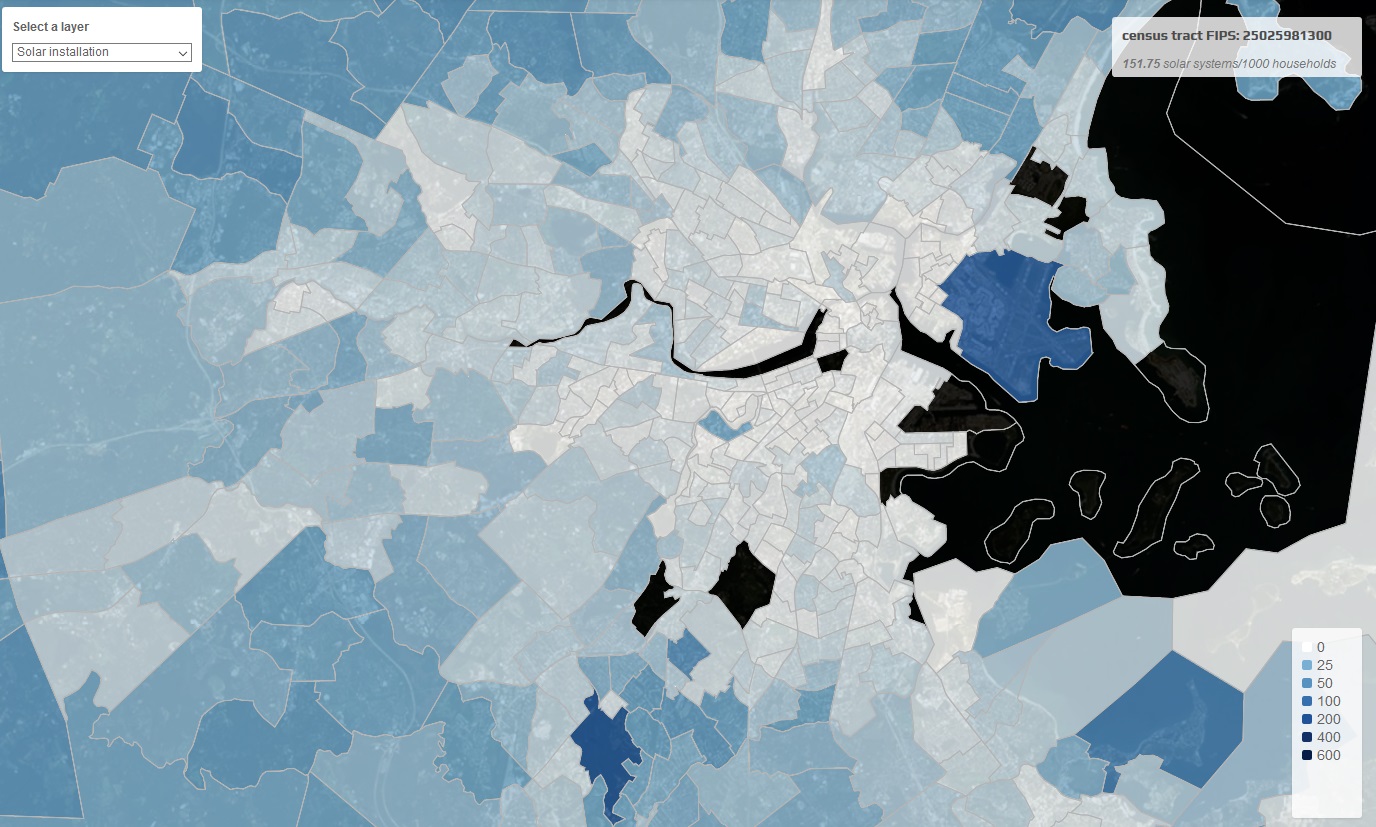
Basic plotting of this data produces all kinds of interesting new info. You can compare solar installation density at the state, county, census tract, or even square mile level and compare that to all kinds of other metrics — average sunny days per year, household income, voting preference, and so on.
A couple interesting findings: Only 4 percent of all census tracts (roughly 3,000 out of 75,000) had more than 100 residential-scale solar systems, meaning installations are highly concentrated. Residential solar made up 87 percent of the total installation count, but with a median size of around 25 square meters, only 34 percent of the total solar cell surface area.
Peak deployment density can be found where there are about a thousand people per square mile — think a small town or suburb, not a major city. And there’s a sort of inflection point at which people start installing: when an area receives more than 4.5 kWh per square meter per day of solar radiation. How that corresponds to weather, location, exposure and so on is a more complicated question.
This and other demographics are all good information to know if you want to invest in solar, since they basically tell you where it’s justified or needed.
“We have created and released a website where you can play with the data at the aggregated level (we are keeping it at census tract level) to respect the privacy of consumers,” Rajagopal said. “We are exploring how to make individual detections public while respecting privacy (perhaps by encouraging public participation and crowdsourcing).”
“We decided to share all of the work in open source to encourage others in industry and academia to utilize both the method as well as the data to produce more insights. We feel that changes need to happen fast, and this is one of the ways to aid in that. Perhaps in the future, services can be built around this type of data,” he continued.
Plans are underway to expand the service to the rest of the U.S. and other countries as well. The data is available to peruse here, or here as a map; the team’s paper describing the project was published today in the journal Joule.
from TechCrunch https://ift.tt/2EvvHx6
via IFTTT
Comments
Post a Comment